Inaccurate marketing claims and outcomes reports are proliferating. The Validation Institute has staked out a position as the leader in assisting/promoting vendors and consultants in the “Integrity Segment” of the healthcare services market.
How can you tell if your adviser is in the Integrity Segment? The easiest way: did they send you to this series or did you have to find it on your own?
The first installment covered regression to the mean. This installment features the fallacy of using non-participants as a control for participants. This fallacy led the Food and Drug Administration to reject this methodology more than half a century ago. And, as we’ll see through examples below, correctly so.
Yet this news never reached the employee health services industry. Vendors routinely compare participants to non-participants, or measure just on participants vs. “what would have happened.” Buyers don’t insist on controlling for participation bias, largely due to lack of understanding. Vendors not validated by the Validation Institute (VI) rarely offer to control for participation bias. Such a control would undercut their own performance claims, because participants always outperform nonparticipants.
Participation bias is even more invalidating in employee health services than in drug trials. The latter usually require only taking a pill and tracking results. The former requires very active participation. Further, those who initially volunteer and then drop out are never counted as participants. Often the actual dropout rate is never even reported. The result is what’s known in the industry as “last man standing” programs, because the only people whose outcomes are counted are the initial voluntary participants who stuck with the program the entire time.
This explains why VI – validated programs – which self-select to apply for VI validation because they actually accomplish something – make such modest claims, as compared to invalid vendors. It’s because modest claims are what they actually achieve…but modest valid claims trump massive invalid claims.
“Accidental” proofs of study design invalidity
The beauty of the first two proofs below is that they constitute what a litigator would call “declarations against interest,” meaning that the perpetrators’ own statements invalidate their own arguments. The “researchers” (wellness promoters) accidentally proved the opposite of what they intended to prove, without acknowledging it in the first case, or realizing it in the second.
These two cases, discussed at length here, are summarized below:
- Using the same employee subjects, a program measured outcomes both ways: through a high-quality randomization and also through participants-vs-non-participants;
- Participants were separated from non-participants but not offered a program to participate in.
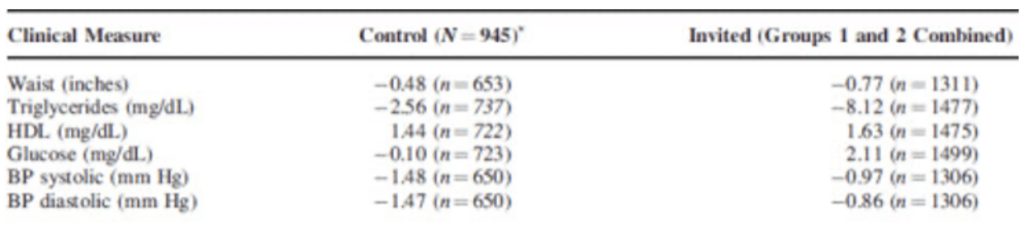
In the first case, a large group of employees without a diagnosis of/history of hospitalization for diabetes or heart disease was divided into:
- Group A, to whom invitations to participate would be offered;
- Group B, employees “matched” to the invited group using demographics and claims history, for whom nothing special was done.
The population was separated before any invitations were issued to Group A, making this a valid — and extremely well-designed — comparison. The “invited” Group A then included both participants (about 14% were willing to submit to the program, of which almost a quarter dropped out, leaving 11%) and non-participants.
The intervention was to use people’s DNA to tell them they were at risk for diabetes or heart disease, and then coach them. Since there were no hospitalizations or ER visits specific to those events beforehand as part of the study design, it would be arithmetically impossible to reduce the relevant hospitalization rate of 0. And yet $1464/participant in savings was found in the first year for the “last man standing” group of the 11% of Group A invitees who actually completed the program, vs. those Group A invitees who declined the invitation.
Using the valid randomized control methodology, the participants, dropouts and non-participants were then recombined into the full “invited” Group A…and compared to the control Group B. Though no cost comparisons were offered, there was essentially no difference-of-differences between these two groups in any relevant clinical indicators. While all changes in both groups were fairly trivial, the latter three here trended in the “wrong” direction for the Group A vs. the Group B control.
Along with the fact that there were no relevant hospitalizations to reduce in the first place, the near-total absence of change in clinical indicators makes it impossible for any savings to be achieved, let alone $1434, among the highest first-year claimed savings in history.
Dr. Soern Mattke of RAND “congratulated” the vendor on using an excellent study design, but “wish[es] they had actually applied this rigor to the analysis.” He also commented:
- To judge the true program effect, we need to look at its impact on the eligible population, not just on the subset that volunteered to join. The authors focus mostly on the results in the participants, which would be appropriate as a secondary analysis, and play down the finding of no effect based on the intent-to-treat analysis.
Dr. Nortin Hadler, a noted author and researcher who is on the advisory board of the publishing journal, wrote:
- I have long been on the Editorial Board of JOEM. However, I was not involved in the peer review or Editorial decisions regarding the Aetna study. If I had been, the issues Al Lewis is raising would have been considered if not determinative.
However, we disagree with Dr. Hadler. Had this article not been published, a valuable piece of evidence on the invalidity of a participation-based study design would never have seen the light of day.
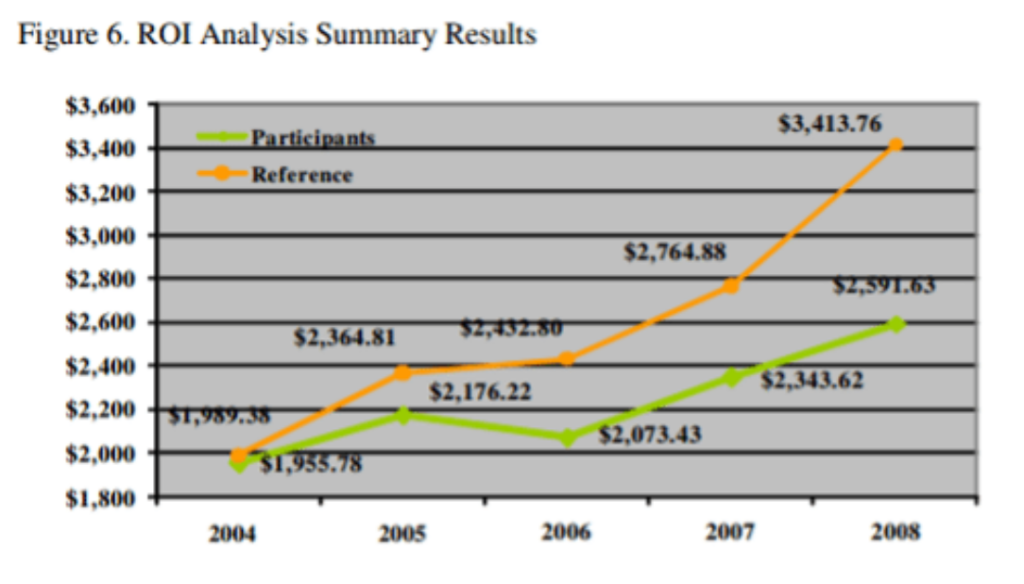
Fortunately, there is an even more valuable “declaration against interest.” An award-winning wellness program inadvertently demonstrated that participants outperform “matched” non-participants even if there is not a program to participate in.
Here is the actual slide, pulled from the Koop Award submission:

http://thehealthproject.com/wp-content/uploads/2017/10/EastmanEval-original.pdf
The two groups were separated and “matched” in 2004. The program started in 2006. During the two years between the separation and the actual program implementation, the would-be participants dramatically outperformed the non-participants – despite not having a program to participate in.
As between deliberate deceit and simple ignorance of study design, we normally give vendors or consultants the benefit of the doubt. Then we urge them to take our courses in Critical Outcomes Report Analysis in order to learn how to do analysis. However, there is no doubt in this case: this was a deliberate deception. After the slide was exposed by the New York Times’ economics bloggers, the head of the Koop Committee, Ron Goetzel, removed all the X-axis labels from the slide above, and referred to previously published slide as “unfortunately mislabeled.”
No doubt this erasure was to head off the existential threat to the wellness industry, were the existence and magnitude of participation bias to become common knowledge. He also posted an “erratum” message:
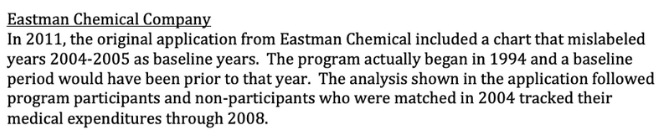
More recently, though, researchers involved in the original study insisted that the real data be re-posted. The inaccurate display was then re-replaced with the correct display, where it resides today. (The Erratum, ironically erroneous itself, was not removed.)
Randomized control trials invalidate the participants-only methodology
Consistent with the hypothesis and with the acknowledgement in the health promotion industry’s trade association that “randomized control trials exhibited negative ROIs,” every randomized control trial shows not just zero savings but zero impact at all.
BJ’s Wholesale Club featured a “cluster randomization,” in which employees in some locations were offered the wellness program while others weren’t. There was no significant difference in objective indicators between the control and study groups.
The National Bureau of Economic Research conducted a more conventional randomized control trial at the University of Illinois. No difference was found between the control and study groups after one year. The Year 2 results were virtually identical.
This just in: a WELCOA case study self-invaliding
WELCOA, according to their original website, was founded by the inventor of the all-you-can-eat cafetera-stye restaurant, Warren Buffet. Following a brief fling with validity when Ryan Picarella was the CEO, they have returned to their roots in massive overstatement of savings:
On April Fools Day, they announced that a “Premier Provider” –meaning one who paid them for an advertisement – “revealed” the “eye-opening” statistic that highly engaged participants in their wellness program incur 24% fewer claims than low-engaged members:

What makes this massive overstatement of savings impossible to attribute to the program itself – along with the fact that wellness loses money – is that wellness-sensitive medical admissions account for only about 3% of total costs.
For their program to save 24%, they’d have to wipe out all those admissions, plus every other hospital admission except birth events. And do it without increasing prevention costs.
Nope, it’s all in the study design. Even just to call this a “study design” is itself a massive overstatement.
What a buyer needs to know and do
Very few if any buyers would be willing to subject their employees to an RCT, for many reasons. Among other things, it’s an ERISA violation to offer benefits to some employees but not to other similarly situated ones. However, you don’t need to do RCTs. Simply being aware of this bias should be sufficient to contract against it.
Instead of measuring participants against non-participants, roll them all back up into the total population, and compare that to a historic benchmark. This is problematic in the era of COVID. It is not possible for most interventions to compare 2020 – or 2021 – to 2019.
However, there are some ways you can validate outcomes for 2020.
First, you can compare the outcomes of one intervention/vendor to the outcomes where there was no intervention – where the healthcare issue in question would be comparable to others that were similarly affected by COVID. Here are three examples:
- All elective surgeries were reduced by COVID last year. Suppose all your elective surgeries declined by 70%, as a group, vs. 2019. But in late 2019 you put into place a musculoskeletal program. If musculoskeletal surgeries declined by 80% in 2020, you could credit the vendor with a 10-point improvement.
- All condition-sensitive medical admissions and ER visits declined as well, by about 40%. This category includes asthma, CAD, COPD, diabetes and heart failure. If you put into place a diabetes intervention, diabetes should have declined noticeably more than the others did. Here is a pre-COVID study in which diabetes admissions moved significantly while the others stayed the same. That’s what you’re looking for: a “difference of differences.”
- You put a preauthorization program into place for CT scans, MRIs and PET scans. All imaging declined last year. In previous years, you probably had a fairly consistent ratio of high-cost scans to x-rays. While everything would have fallen this year, that particular ratio should have declined. The vendor would get credit for the decline in the ratio, not the total decline in scans.
If you have questions about other 2020 outcomes measures that are likely beyond the scope of your consultants, please contact the Validation Institute. We should be able to offer some guidance.
The next installment will explore the role of “trend inflation” in generating savings…and how to spot it as a fallacy.


